
Responsible Streaming is an approach that has three objectives :
- to measure GHG emissions emissions from streaming
- to reduce these emissions
- to contribute to the sequestration of carbon
In order to raise its clients’ awareness of the environmental impact of audio and video streaming, Mediatech has undertaken the development of a method to measure the greenhouse gases (GHG) emitted by the activity of Streamlike platform clients. It is based on measurements made by Streamlike and on a modeling tool based on the work of The Shift Project . To ensure the relevance of the methodology, the tool was developed in collaboration with Maxime Efoui-Hess, whose expertise on numerical issues stems in particular from his involvement in the think tank’s modelling work.
The objective of this unprecedented initiative was
- to understand the orders of magnitude involved, following the more or less serious information circulating in the press on this subject,
- to be able to account for these emissions as part of a carbon balance sheet,
- to recommend good practices to reduce its environmental impact,
- to consider offsetting emissions, for a “decarbonised” streaming.
We detail the method used, not only to be transparent to our customers but also to invite other video platforms to carry out similar measurements.
Share of digital in GHG emissions
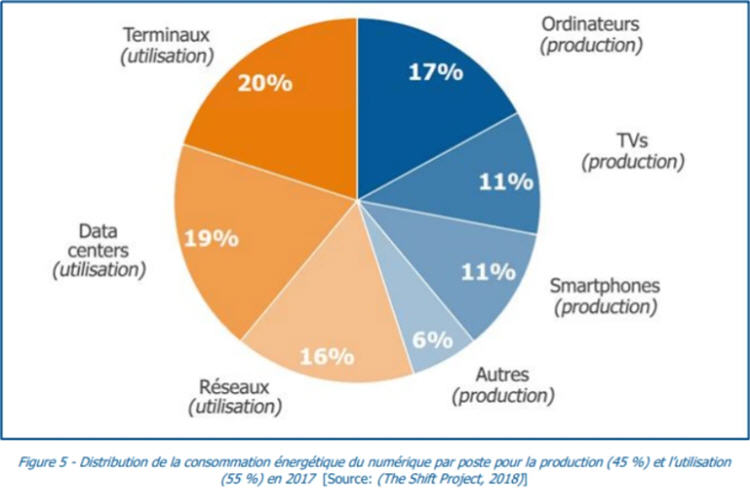
Digital technologies include devices (smartphones, computers, tablets etc.), data centres and network infrastructures (land and submarine cables, mobile network antennas, fibre optics etc.) that connect them together to exchange data. Each of these elements requires energy not only to function (use phase) but also, before that, to be manufactured.
The production of digital technologies accounts for 45% of energy consumption, compared to 55% for their use.
In 2019, nearly 4% of global carbon emissions were due to digital production and use. This is twice as much as the 2% usually attributed to civil air transport and, with an increase of 8% per year today, this share could double by 2025 to reach 8% of the total – as much as global emissions from cars and two-wheelers.
Compliance with the Paris Agreements, whose self-imposed 2°C target is designed to ensure the resilience of our systems, requires global emissions to be reduced by 5% per year. At present, however, global emissions continue to rise.
Measurable data
Managing and streaming digital media involves four components:
- an infrastructure hosted in a datacenter that is part of a “Cloud”, composed of servers, storage volumes and network equipment
- a “Content Delivery Network” (CDN) made up of a multitude of data centres (POPs) spread around the world
- fixed or mobile consultation devices (PCs, smartphones, tablets, TV…)
- the telecommunications networks that interconnect this equipment and constitute the “Internet”
To measure the GHG emissions from these elements, their electricity consumption must be calculated and a “carbon intensity” coefficient applied. Depending on the country where the electricity is consumed, its production will have generated more or less CO2 emissions.
The graph below shows the differences in carbon intensity factors between countries and continents, depending mainly on the share of nuclear or renewable electricity.
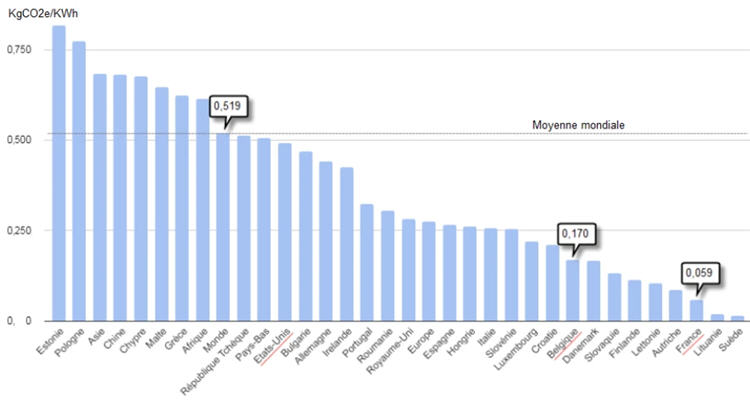
Carbon intensities can be consulted in real time on this interactive map.
When the carbon intensity of a country is unknown, the average intensity of the continent, or failing that a world average of 0.519 kgCO2e / kWh is applied.
Platform contribution
The power consumption of a Cloud infrastructure is complex to estimate because of the use of virtual machines that exploit only part of the resources of physical machines. These machines are shared between several applications and users and the operator of the Cloud platform do not provide differentiated electric consumption data.
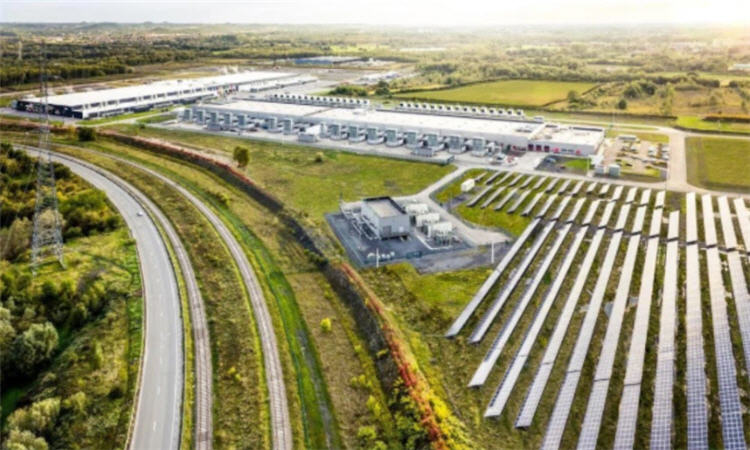
The Streamlike platform is hosted on the Saint-Ghislain datacenter in Belgium, which is part of the Google Cloud. Its power supply is fully compensated, with a share of electricity from an adjacent solar power plant and the purchase of the remainder in renewable energies. There is therefore no need to calculate or over-compensate for it.
CDN contribution
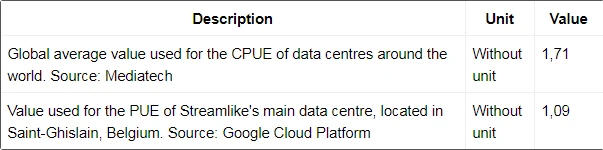
The “1byte parametric” model developed in partnership with Maxime Efoui-Hess based on the works of The Shift Project makes it possible to estimate the power consumption of a CDN-type infrastructure as a function of the amount of data passing through. We will assume that the energy efficiency of the data centers that make up the Cloudflare CDN is at the level of the world average (PUE = 1.71).
With a CDN, one must distinguish different types of data transits:
- the “cache fill” which consists of requesting content from the platform (called “Origin”) and storing it on a datacenter (“POP” or “point of presence”) that is part of the CDN and located closest to the Internet user who made the request.
- the “egress cache”, which consists of transferring the data from the POP to the Internet user.
- the “cache to cache fill”, which consists in transferring the contents of a POP which was already storing it to another which requests it.
For example, if an Internet user in the Boston area requests a video, it will first be transferred from the Streamlike platform in Belgium (“origin”) to the Cloudflare POP in Boston, then from this POP to the Internet user. If a user from Hong Kong requests the same video, it will be copied from the Boston POP to the Hong Kong POP and then delivered to that user.
The power consumption associated with the implementation of the CDN infrastructure can therefore be measured on the basis of the volume of data transferred. Gigabytes (GB) are transformed into KWh consumed at different points on the planet. These KWh have a variable carbon intensity depending on the country. A local carbon intensity (of the country of consultation) will therefore be applied for “cache fill” and “cache egress” and a global average intensity for “cache to cache fill”.
Network contribution
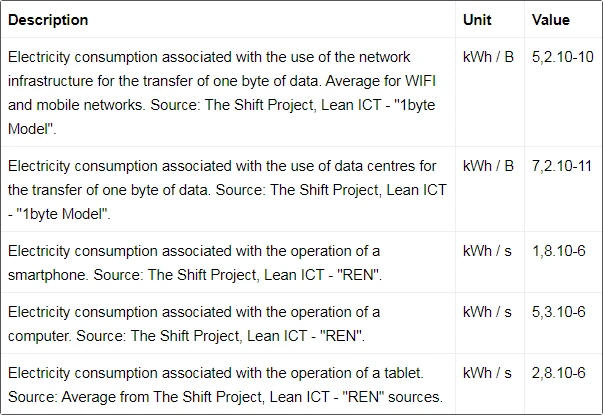
The “1byte parametric” model also provides an estimate of the power consumption of all data center and terminal interconnections involved in the transfer of a gigabyte of data. The “network” covers all the telecommunications equipment of public or private operators and Internet service providers that connect the platform to Internet users via cables, fibres, relay antennas or WiFi terminals.
In the same way as the electricity consumption of the CDN infrastructure was estimated, the network’s consumption can be estimated based on the volume of data transit, as well as its carbon impact depending on where the electricity is consumed.
Device contribution
It is possible to precisely associate each byte transferred to the type of device on which it was read: desktop, smartphone, tablet, phablet, TV, console… Each device has a different average power consumption.
For the purposes of this measurement, we have chosen to consider the power consumption of the device only during the media playback time. On the other hand, we consider that during this time, 100% of the energy consumed by the terminal is devoted to this playback.
Knowing the distribution of media playback according to the type of terminal, the average listening time for each media, the geographical location of the playback and the average electricity consumption of each type of terminal, we know how to determine the volumes of GHGs directly related to the playback of media on the devices.
Other sources of GHGs
As we saw above, the emissions of the Streamlike platform are already fully compensated. It does, however, consume energy, but the GHGs linked to the platform (storage and calculations) are very low compared to those linked to data transfer. This does not mean that measures to reduce energy needs should not be put in place. For example:
- A “cold archive” makes it possible to store little-used media, on servers that are only turned on on demand.
- Hardware encoding (GPU) is faster than software encoding, generating lower power consumption.
- Tolerating a delay of 1/10s at the start of video playback allows to reduce considerably the size and power of the infrastructure.
Adopting best practices is the best way to control and significantly limit the carbon footprint of streaming.
Individual carbon footprints
For each media playback, the analysis of the broadcast logs gives us information on the quantity of data transmitted, the location of the consultation, the type of device… and the identity of the owner of the media. Thus, all the calculations described above can be performed daily to provide the most accurate representation possible of the GHG emissions of each Streamlike client company.
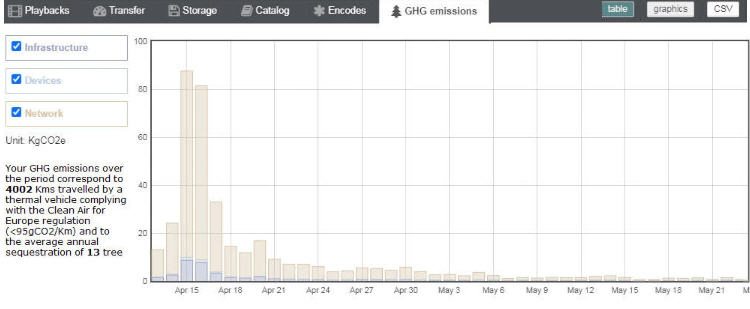
The totalization of GHG emissions thus enriches the collection of global indicators available in the form of totals or evolution curves over a period of time.
Sample representation of GHG emissions
Compensation
The approach undertaken by Mediatech in collaboration with Maxime Efoui-Hess, on the basis of the work carried out by The Shift Project has the following objectives:
- provide the necessary measures to raise awareness of the impact of digital activities,
- observe the effect of the implementation of good practices
- adapt the level of compensation, for example by planting trees.
This is reflected in environmental indicators integrated into the Streamlike console.
In order to be able to claim a virtually carbon-free operation of Streamlike, Mediatech is committed to implementing a contribution to the storage of the equivalent of the GHGs emitted by its customers’ activity, through the planting of trees.
Each client will receive a certificate attesting that their digital activity has been fully decarbonated for a given period, with mention of the quantity of GHGs concerned and the contribution made to absorb the volume of CO2: number, type and location of plantations.
Given that there are not enough areas to be reforested on our planet to absorb all of our CO2 emissions and that this carbon sequestration via forests takes time and can be subject to uncertainties, it remains essential and a priority to apply good “responsible streaming” practices.
Calculation constants and variables
The energy efficiency of data centers is defined by the PUE (Power Usage Effectiveness).
Lectures choisies
Selected readings
The Shift Project : “Climat : l’insoutenable usage de la vidéo en ligne – Un cas pratique pour la sobriété numérique”, 11 juillet 2019
Lien vers les supports de présentation : https://bit.ly/38hn1GB
Lien vers le rapport intermédiaire « Lean ICT – Déployer la sobriété numérique » : https://bit.ly/37i5Xiq
Carbone 4 : “Faire Sa Part ? Pouvoir Et Responsabilité Des Individus, Des Entreprises Et De L’Etat Face À L’urgence Climatique”, 21 juin 2019
http://www.carbone4.com/publication-faire-sa-part/
University of Bristol, UK, “Evaluating Sustainable Interaction Design of Digital Services: The Case of YouTube”, mai 2019
https://dl.acm.org/citation.cfm?id=3300627
Google Cloud Platform : ”Positive energy: Belgian site becomes first Google data center to add on-site solar”
https://sustainability.google/reports/environmental-report-2019/
Le Monde : “ Comment « Le Monde » traque et réduit l’empreinte carbone de ses vidéos”, 13 février 2020
The Conversation : “L’inquiétante trajectoire de la consommation énergétique du numérique”, 2 mars 2020
http://theconversation.com/linquietante-trajectoire-de-la-consommation-energetique-du-numerique-132532
Youmatter.world : “Sobriété numérique : faisons du numérique un allié pour la transition écologique”, 11 février 2020
https://youmatter.world/fr/sobriete-numerique-transition-ecologique-durable/
ZDNet : “Vidéo : les FAI et opérateurs telco bientôt contraints d’informer les utilisateurs sur leur impact carbone”, 22 février 2020
https://www.zdnet.fr/actualites/video-les-fai-et-operateurs-telco-bientot-contraints-d-informer-les-utilisateurs-sur-leur-impact-carbone-39899497.htm
Alternatives Economiques N°397 : Dossier : “Pollution : la face cachée du numérique”, janvier 2020
https://www.alternatives-economiques.fr/publication/pollution-face-cachee-numerique/197001010100-00091352.html
Alternatives Economiques : “ La vidéo en ligne, une bombe climatique” , 2 septembre 2019
https://www.alternatives-economiques.fr/video-ligne-une-bombe-climatique/00090122
GreenIT : “ Vidéo en ligne : quels impacts environnementaux ?”, juillet 2019
https://www.greenit.fr/2019/07/22/%ef%bb%bfvideo-en-ligne-quels-impacts-environnementaux/
La Croix : “Jeu vidéo en streaming, quel impact sur l’environnement ?”, 28 mars 2019
https://www.la-croix.com/Sciences-et-ethique/Numerique/Jeu-video-streaming-quel-impact-lenvironnement-2019-03-28-1201011984
Le Parisien : “La pollution invisible du Net”, 10 janvier 2017
http://www.leparisien.fr/societe/la-pollution-invisible-du-net-10-01-2017-6546294.php
Décrypter l’énergie : “La révolution numérique fera-t-elle exploser nos consommations d’énergie ?”, décembre 2017
http://decrypterlenergie.org/la-revolution-numerique-fera-t-elle-exploser-nos-consommations-denergie
Radio France : “Le numérique mondial consomme cinq fois plus de ressources naturelles que le parc automobile français”, 21 octobre 2019
https://www.francetvinfo.fr/meteo/climat/info-franceinfo-le-numerique-mondial-consomme-cinq-fois-plus-de-ressources-naturelles-que-le-parc-automobile-francais_3667963.html#xtor=CS2-765-[autres]-
GreenIT : “Numérique : 60 % de l’énergie finale en 2025 “, janvier 2018
https://www.greenit.fr/2018/01/30/numerique-60-de-lenergie-finale-2025/
BigThink : “Online video streaming should go green, say experts”, janvier 2020
https://bigthink.com/surprising-science/netflix-binge-watching-makes-climate-change-worse
Streaming Media : “It’s Time to Make Streaming Greener “, 24 mars 2020
https://www.streamingmedia.com/Articles/Post/Blog/Its-Time-to-Make-Streaming-Greener-139916.aspx
Libération : “Pourquoi Netflix, YouTube et YouPorn réchauffent la planète”, 5 septembre 2019
https://www.liberation.fr/planete/2019/09/05/pourquoi-netflix-youtube-et-youporn-rechauffent-la-planete_1743212
Carbonbrief.org : “Factcheck: What is the carbon footprint of streaming video on Netflix?”, 25 février 2020
https://www.carbonbrief.org/factcheck-what-is-the-carbon-footprint-of-streaming-video-on-netflix
New Scientist : “Binge watching TV isn’t as bad for the climate as some reports suggest”, février 2020
https://www.newscientist.com/article/2235713-binge-watching-tv-isnt-as-bad-for-the-climate-as-some-reports-suggest/